Research Article | | Peer-Reviewed

Diversity of Fishery Resources in Mangrove Ecosystems: Case of Saloum Delta in Senegal

Received: 2 December 2025     Accepted: 18 December 2025     Published: 26 January 2026
Views:       Downloads:
Abstract

The objective of this study is to enhance the understanding of the diversity and structure of fishery resources. To achieve this, we conducted beach seine catches in two seasons from 2020 to 2022 at six sites within the Gandoule Marine Protected Area. All individuals captured were identified and counted, and their weight and size were measured. In total, 58 species from 46 genera and 31 families were recorded. Diversity, weight, and growth parameters of fishery resources showed variation across time and locations. Species richness and abundance varied significantly (p<0.05) between sites. Baradia (13.33±6.02) had significantly higher richness than Pass Fambine (5.66±4.27). The highest abundances were at Donakal (136.67±148.73), with the lowest at Pass Diamniadio (24.67±13.61). Over the study period, average richness declined from 10.83±6.63 to 7.33±2.87 species, and abundance decreased from 82.58±72.98 to 23.67±12.52 individuals from 2020 to 2022. There was no significant difference (p>0.05) in overall diversity among sites and years. Analysis of structural characteristics revealed significant spatio-temporal variation in biomass (P<0.05). Donakal (20.14±6.43kg) showed higher biomass than Pass Fambine (5.11±1.55kg). Biomass declined from 11.81±11.54kg in 2020 to 3.97±2.36kg in 2022, while the proportion of small fish rose from 69.47% to 72.73%. Fish length decreased significantly (p<0.05) over the study period, from 257.12±40.69cm to 157.48±16.71cm. Despite some contradictory data on the proportion of small fish (which rose then fell), the trends indicate a decline in fishery resources in the Saloum Delta, attributed to overexploitation, habitat degradation, and climate change.

Published in Agriculture, Forestry and Fisheries (Volume 15, Issue 1)
DOI 10.11648/j.aff.20261501.13
Page(s) 22-36
Creative Commons

This is an Open Access article, distributed under the terms of the Creative Commons Attribution 4.0 International License (http://creativecommons.org/licenses/by/4.0/), which permits unrestricted use, distribution and reproduction in any medium or format, provided the original work is properly cited.

Copyright

Copyright © The Author(s), 2026. Published by Science Publishing Group

Keywords

Diversity, Biomass, Size, Structure, Fishery Resources, Mangrove Ecosystems, Marine Protected Area

1. Introduction
Mangrove ecosystems are essential coastal environments that provide extensive ecological and socioeconomic benefits to both human societies and the natural environment. . The importance of these ecosystems must be linked to the diversity of environments and a considerable potential for assembling marine, continental, and estuarine species with a broad biogeographic spectrum . Saloum Delta is a tropical mangrove ecosystem, rich in biodiversity, which provides livelihoods for over 100,000 inhabitants .
Despite its importance, these ecosystems have undergone accelerated degradation caused by multiple anthropogenic and natural factors. Economic activities such as mining, industry, and ponds are the main cause of mangrove damage, which in turn leads to increased disasters, CO2 emissions, and decreased community income. . Human activities are also affected, for example, by the exploitation of wood for processing, cooking, and construction. In addition, the longstanding rainfall deficit in the Sahel zone, combined with high evaporation rates and the gentle downstream slope of the Sine-Saloum estuary, has led to the inversion of the salinity gradient and resulting hyperhalinity . The rupture of the Sangomar spire has accelerated landscape change in the Saloum estuary and altered its socio-economic environment, leading to the loss of essential vegetation cover . In the Saloum Delta, mangroves and the vegetation of sandy islands are severely affected by drought and intense human pressures , with serious consequences for fisheries resources.
To address this issue, conservation and management strategies have been implemented, including less-impact exploitation methods of cutting mangrove wood, exploiting juveniles, and using fishing nets. Reforestation activities carried out by local communities, as well as awareness-raising campaigns on the environmental and socio-economic importance of mangroves and sustainable resource exploitation methods. For better management and conservation of fishery resources, it is important to characterize these resources by identifying composition and diversity, weight and structural changes and spatio-temporal variation of fishery resources.
This research aimed to contribute to a better knowledge of fishery resources in mangrove ecosystems by evaluating the composition, diversity, biomass and community structure of these resources and identifying patterns of variation and ecological processes.
2. Materials and Methods
2.1. Study Area
Figure 1. Location of Saloum Delta.
This study was conducted in the Saloum Delta. Saloum Delta is located to the west of Foundiougne and Missirah in Senegal, between latitudes 13° 5 and 14°. It is limited to the North by the Saloum and to the South by the Gambian border (Figure 1). The whole constitutes the Saloum islands . Located in the central west of Senegal in the Sine Saloum region, the Saloum Delta spans approximately 500,000 ha. It is characterized by a marine, estuarine, lakeside and wetland zone, and its various sites fulfil the classic functions of a wetland . Saloum Delta is an estuary classified as a wetland of international importance and a huge funnel-shaped estuary 11]. It is made up of three main branches (Saloum, Bandiala and Diombos). Saloum, partially separated from the sea by the spit of Sangomar, has been since its rupture into two openings, Sangomar and Lagoba . The zone is an integral part of the Sudan domain with a climate marked by the alternation of two seasons a dry season and a wet season or rainy season. The temperature ranged from 15°C to 35°C depending on the season. The temperature drops of up to 15°C, while in the region, there are differences of 25°C to 40°C for the same period . Sangomar area records monthly average temperatures above 32°C during the rainy season and 27°C during the dry season . The rainfall recorded in the Marine Protected Area of Gandoule over the last last five years (2019-2023) showed low precipitation of 686mm/year. For the Sangomar area, precipitation was significantly higher, at 722mm/year.
For the soils of Saloum Estuary, tannes occupied a relatively larger extension . There are six types of soils: halomorphic, acidic sulphate or tanne, raw mineral and poorly evolved, calcimorphic, leached tropical ferruginous or dior, hydromorphic or deck and slightly leached tropical ferruginous soils 15].
The vegetation covers an area of about 80,000 ha Saloum Delta Biosphere Reserve is home to at least 188 species, or 9% of the woody and herbaceous plant species in Senegal, grouped into 50 families, including 30% of the higher plant families . Six woody species of mangroves recorded in this area are the Rhizophora mangle, Rhizophora racemosa, Rhizophora harrisonii, Laguncularia racemosa, Avicennia germinans and Conocarpus erectus .
Fish diversity in the Saloum estuary is divided into three main assemblages, which are continental, strictly estuarine and marine species . Estuarine resources have relatively high overall species richness, comprising 114 species. The most represented families are Carangidae, Mugilidae and Sciaenidae . Cartilaginous fish are represented by 80 species divided into 30 families; bony fish, comprising nearly 470 species and 110 families, several of which are overexploited; marine mammals, essentially whales, dolphins and manatees, but sometimes also monk seals .
Sample
Saloum estuary and its bays in the Gandoule Marine Protected Area have been chosen for the experimental fishing. This choice was justified by the fact that there were few scientific studies on this part of the Saloum delta. Experimental fisheries were conducted at different stations or sites. Sites were chosen by taking into account the spatial distribution within the Marine Protected Area (MPA). Experimental catches or fishing operations were carried out at six fixed sites (Figure 2) over a period of three years (2020, 2021 and 2022). For each year, sampling was conducted over two seasons (hot and cold). The experimental fishing was done with a beach seine. At each site, two fishing catches were made.
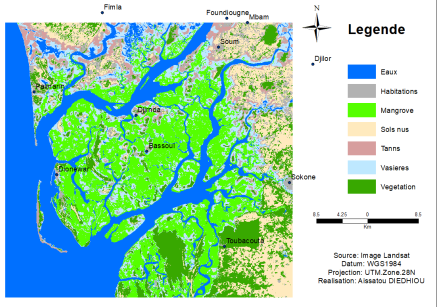
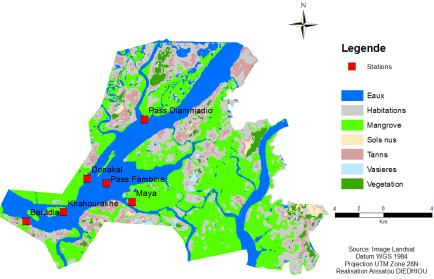
Figure 2. Location of experimental fishing sites in Gandoule Marine Protected Area.
2.2. Collection of Diversity and Structural Parameters
Experimental fishing was carried out during high tides using a 25 mm beach seine net, as this was more suitable for the area. At each site, two catches were made for each season (warm and cold).
Fishing catch was deposited in a box, the individuals that make up the sample were placed in a tarp, then sorted by species, counted, measured and weighed. An ichthyometer was used to measure the size of fish, and a scale was used to estimate the weight of fish.
2.3. Data Processing and Analysis
Identification and counting data were used to determine diversity parameters (richness, diversity and abundance).
1) Species richness
Total species richness (S) is the total number of species in a given ecosystem .
2) Shannon and Simpson indices
The Shannon index is used to measure species diversity. The value of the Shannon index is between 1 and 5 (without units).
𝑯′ = −∑𝒑𝒊ln𝒑𝒊(1)
With 𝒑𝒊 is the relative abundance of species 𝒊.
The Simpson index allows expressing the probability that two individuals drawn at random belong to the same species.
D=Σ𝒑𝒊²(2)
3) Relative abundance
Abundance is the number of individuals of a given species in a given area. The relative abundance of species i is calculated by the following formula:
Pi=number of individuals of the speciesitotal number of individuals×100(3)
The weight and structural characteristics of resources were analyzed in Minitab 14 Software to observe the proportion and average fish biomass and size at different sites and years. To determine the proportions of small and large fish, the following formula was used:
Xi̅=Xi-X̅(4)
With Xi̅= differential (positive or negative) of biomass or size of the individual i
Xi =biomass or size of the individual i
X̅ =average biomass or size
From this formula, the proportions of small and large individuals were determined.
Data from experimental fisheries were entered into an Excel spreadsheet. The R software was used with the BiodiversityR package to calculate and determine diversity and difference in composition (ecological distance) based on Bray-Curtis. To determine the spatio-temporal distribution of species and families' abundance of fisheries resources, a hierarchical analysis or clustering was carried out. Principal Component Analyses (PCA) of diversity and structural parameters to characterize spatio-temporal groups. An analysis of variance (ANOVA) and a Tukey test at the 5% threshold were carried out to compare the spatio-temporal variation in fishery resource parameters. To document the relationship between fishery resource variables, correlation and linear regression analyses were performed in R version 4.4.1.
3. Results
3.1. Composition and Diversity of Fishery Resources
3.1.1. Composition of Fishery Resources
Legend: BD=Baradia; DK=Donakal; KH=Khahourakhe; MA=Maya; PD=Pass Diamniadio; PF=Pass Fambine

Download: Download full-size image

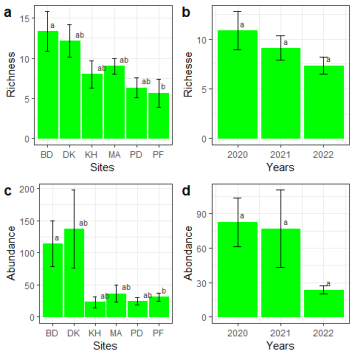
Figure 3. Spatial (a, c) and temporal (b, d) variation in the wealth and abundance of fishery resources.
The results of fish species monitoring between 2020 and 2022 showed a composition of 58 species belonging to 46 genera and 31 families. Temporal variation in the richness and abundance of fishery resources was not significant (p˃0.05). Specifically, richness decreased from 10.83±6.63 to 7.33±2.87 between 2020 and 2022. Abundance declined gradually from 82.58±72.98 to 23.67±12.52 individuals between 2020 and 2022. The spatial analysis of fisheries resources in Gandoule Marine Protected Area showed a significant variation (p˂0.05) between sites in terms of composition and abundance. Baradia (13.33±6.02) recorded higher richness, followed by Donakal (12.16±5.03) and Maya (9±2.44). The lowest richness was recorded in Khahourakhe (8±4.14), Pass Diamniadio (6.33±2.94) and Pass Fambine (5.66±4.27). In terms of abundance, Donakal (136.67±148.73 individuals) and Baradia (113.83±86.48 individuals) recorded higher abundance than Maya (36.67±32.85 individuals), Pass Fambine (31.17±16.05 individuals), Pass Diamniadio (24.67±13.61 individuals) and Khahourakhe (23.17±21.35 individuals) (Figure 3).
The hierarchical analysis based on the relative abundance of families discriminated between three and two groups, respectively, at the spatial and temporal level (Figure 4). For the sites, the first group was composed of Baradia and Khahourakhe, the second of Maya and Pass Fambine and the third of Donakal and Pass Diamniadio. A greater relative abundance of Portunidae, Batrachoidae, Sepiidae, Sphyraenidae, Muricinae, Clupeidae, Elopidae, Carangidae, Gerreidae and Volutidae characterized the first group. The second group was distinguished by a greater abundance of families Dasyatidae, Mugilidae, Psettodidae and Paralichthyidae. The third group was associated with a higher relative abundance of Haemulidae, Cichlidae, Monodactylidae, Serranidae and Syngnathidae. The year 2020 differed from 2021 and 2022 and was characterized by a greater relative abundance of Cichlidae, Clupeidae, Monodactylidae, Portunidae, Pristigasteridae, Batrachoidae, Haemulidae, Moronidae and Paralichthyidae.
Legend: BD=Baradia; DK=Donakal; KH=Khahourakhe; MA=Maya; PD=Pass Diamniadio; PF=Pass Fambine

Download: Download full-size image

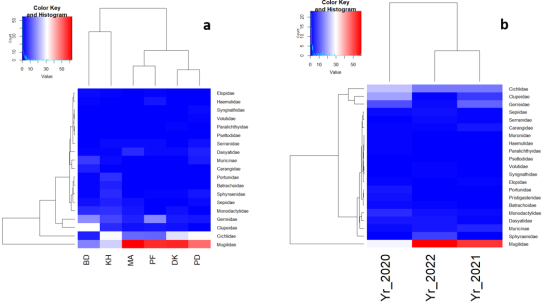
Figure 4. Dendrogram of the spatial variation (a) and temporal (b) of the relative abundance of families of fishery resources.
The hierarchical analysis based on the relative abundance of species showed a variation in distribution and abundance depending on the sites and years (Figure 5). Clustering analysis based on sites revealed four groups. The first group is made up of the Baradia site, the second by Donakal and Khahourakhe, the third by Pass Diamniadio and the fourth by Maya and Pass Fambine. The abundance of fish resource species varies according to the groups. Group 1 was characterized by a better abundance of Ethmalosa fimbriata, Gerres nigri, Murex duplex, Ilisha africana, Caranx senegallus, Murex sp, Chloroscombrus chrysurus and Elops lacerta. Group 2 was distinguished by a good representation of Coptodon guineensis, Parachelon grandisquamis, Hemichromis fasciatus, Monodactylus sebae, Cymbium sp, Batrachoides liberiensis, Sphyraena sphyraena, Sphyraena afra and Citharichtys stamfilii. Group 3 had a higher relative abundance of species Mugil bananensis, Sarotherodon melanotheron, Murex cornutus, Epinephelus aeneus and Hippocampus puntilatus. Group 4 was associated with a better abundance of certain specific species such as Chelon dumerili, Mugil curema, Neochelon falcipinnis, Fontitrygon margarita, Dasyatis margarita, Balistes punctatus, Mugil cephalus, Psettedos belcheri and Cynoglossus senegalensis. For the temporal variation in species abundance, two groups were distinguished. The year 2021 recorded an abundance which was different from 2020 and 2022 and characterized by a more significant representation of Parachelon grandisquamis, Gerres nigri, Murex duplex, Cynoglossus senegalensis, Elops senegalensis, Pomadasys jubelini and Psettedos belcheri.
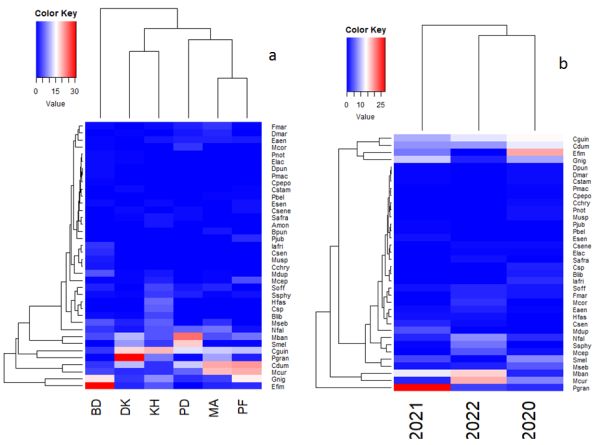
Figure 5. Dendrogram of the spatial variation (a) and temporal (b) of the relative abundance of species of fishery resources.
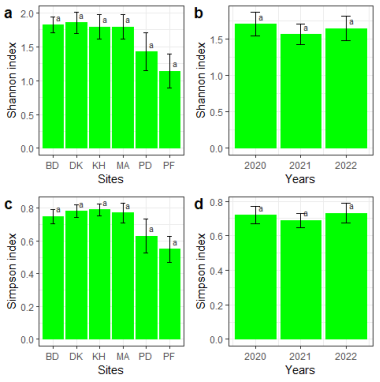
Legend: BD=Baradia; DK=Donakal; KH=Khahourakhe; MA=Maya; PD=Pass Diamniadio; PF=Pass Fambine
Legend: Amo =Acantherus monroviae; Bpu=Balistes punctatus; Blib=Batrachoides liberiensis; Csp=Callinectes sp; Csen=Caranx senegallus; Cdum=Chelon dumerili; Cchry=Chloroscombrus chrysurus; Cstam=Citharichtys stampflii; Cgui=Coptodon guineensis; Cpepo=Cymbium pepo; Cssp1=Cymbium sp; Csene=Cynoglossus senegalensis; Dmar=Dasyatis margarita; Dpun=Dicentrarchus punctatus; Elac=Elops lacerta; Esen=Elops senegalensis; Eaen=Epinephelus aeneus; Efim=Ethmalosa fimbriata; Fmar=Fontitrygon margarita; Gnig=Gerres nigri; Hfas = Hemichromis fasciatus; Iafri=Ilisha africana; Mseb=Monodactylus sebae; Mban=Mugil bananensis; Mcep=Mugil cephalus; Mcur=Mugil curema; Mcor=Murex cornutus; Mdup=Murex duplex; Musp=Murex sp; Nfal=Neochelon falcipinnis; Pgran=Parachelon grandisquamis; Pnot=Penaeus notialis; Pmac=Plectorhinchus macrolepis; Pjub=Pomadasys jubelini; Pbel=Psettodes belcheri; Smel=Sarotherodon melanotheron; Soff=Sepia officinalis; Safra=Sphyraena afra; Ssphy=Sphyraena sphyraena
3.1.2. Diversity of Fishery Resources
The spatio-temporal analysis of the diversity of fishery resources showed a disparity that was not significant (p˃0.05) between sites and years. The Shannon index varied between 1.85±0.37 and 1.14±0.6 nats, and Simpson between 0.79±0.08 and 0.55±0.18. In absolute value, the higher diversity was recorded at Donakal (1.85±0.37) and Khahourakhe (0.79±0.08) for Shannon and Simpson, respectively. Between 2020 and 2022, Shannon and Simpson indices varied slightly. In absolute value, 2020 (1.70±0.54 and 0.72±0.17), 2021(1.56±0.48 and 0.69±0.14) and 2022 (1.64±0.57 and 0.73±0.19) recorded respectively Shannon and Simpson indices 2022 (Figure 6).
Legend: BD=Baradia; DK=Donakal; KH=Khahourakhe; MA=Maya; PD=Pass Diamniadio; PF=Pass Fambine

Download: Download full-size image

Figure 6. Spatial (a, c) and temporal (b, d) variation in the Shannon and Simpson diversity of fishery resources. Spatial (a, c) and temporal (b, d) variation in the Shannon and Simpson diversity of fishery resources.
3.2. Weight and Length Structure of Fisheries Resources
Legend: BD=Baradia; DK=Donakal; KH=Khahourakhe; MA=Maya; PD=Pass Diamniadio; PF=Pass Fambine

Download: Download full-size image

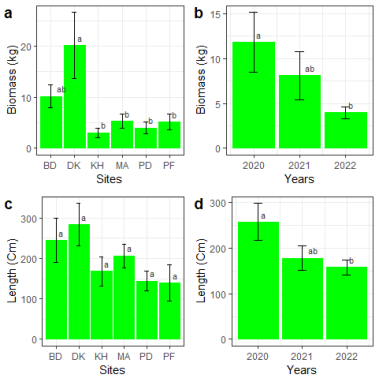
Figure 7. Spatial (a, c) and temporal (b, d) variation in biomass and size of fishery resources.
The structural parameters (biomass and length) of fisheries resources varied significantly (p˂0.05) according to sites and years. Donakal (20.14±14.74kg) and Baradia (10.17±5.52kg) recorded significantly higher biomass, while Khahourakhe had low biomass (3.05±0.91kg). The biomass has experienced a gradual decline and fell from 11.81±11.54 to 3.97±2.36kg between 2020 and 2022. Donakal (283.31±52.49cm) and Baradia (244.98±54.36cm) recorded the length of fish as more important compared to Pass Fambine (138.86±44.75cm). Fish size decreased from 257.12±40.69 to 157.48±16.71cm between 2020 and 2022 (Figure 7).
For weight characteristics, the analysis of fish biomass distribution showed a variation between sites and years. The biomass ranged from 0.1250±0.1119kg in Baradia to 0.2055±0.3894kg in Pass Diamniadio (Figure 8). The proportion of biomass decreased from 0.1737±0.1814 to 0.1293±0.09987kg between 2020 and 2021 and increased from 0.1293±0.09987 to 0.1698±0.145kg between 2021 and 2022. The proportion of small fish ranged from 63.75% (Baradia) to 76.71% (Donakal). The proportion of small fish was 69.47, 63.3 and 72.73% respectively in 2020, 2021 and 2022 (Figure 8).
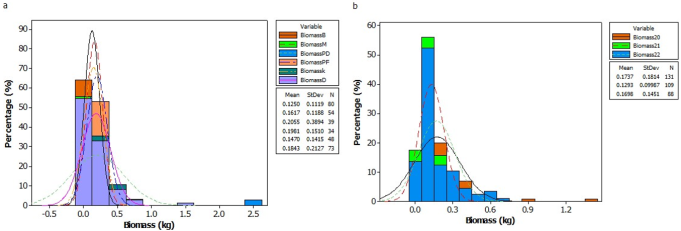
Figure 8. Structure of fish biomass based on sites (a) and time (b).
Analysis of fish length distribution revealed a variation between sites and years (Figure 9). The size of an individual varied from 24.5±9.498cm (Pass Fambine) to 18.37±12.93cm (Baradia). The longest fish were recorded in 2020 (23.55±15.62cm), followed by 2022 (21.48±12.78cm) and 2021 (19.62±8.672cm). The proportion of larger individuals varied from 52.5% (Baradia) to 33.33% (Pass Diamniadio). The proportion of longer individuals increased from 27.48% to 56.82% between 2020 and 2022.
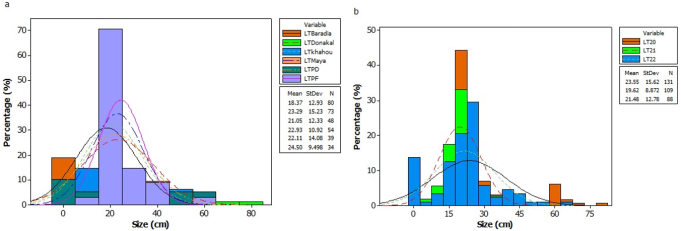
Figure 9. Structure of fish length according to sites (a) and time (b).
3.3. Characteristics of Fisheries Resources Communities
The principal component analysis allowed discriminating and characterizing the groups. The PCA revealed three and two groups based on sites and years. The first group was made up of Donakal and Baradia, the second by Pass Diamniadio and Pass Fambine and the third by Maya and Khahourakhe. The results showed that group 1 was characterized by greater wealth, abundance, size and biomass of fishery resources. While group 3 was marked by a higher Shannon and Simpson diversity. Group 2 was associated with low diversity and less important structural elements. The PCA, according to years, revealed two groups. The first group of 2020 was marked by a size and a high Shannon. Whereas for the one from 2021-2022, particularized by a richness, an abundance, a greater biomass and Simpson (Figure 10).
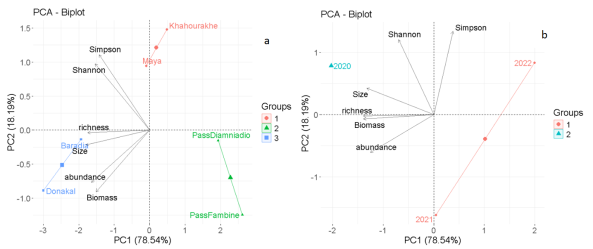
Figure 10. Characteristics of communities based on sites (a) and years (b).
3.4. Relationship Between Variables
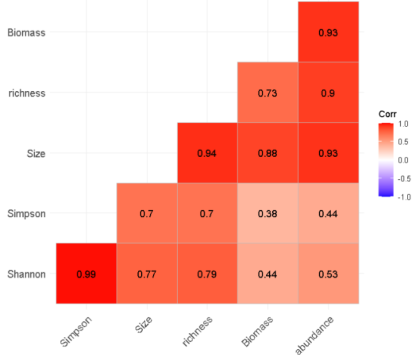
Figure 11. Correlation matrix between diversity and structural parameters of fishery resources.
The correlation analysis showed a strong correlation between most of the diversity and structural variables. The correlation between diversity and structural parameters varied between 44 and 98% (Table 1). The analysis showed that abundance was strongly correlated with biomass (r=0.93), richness (r=0.90) and size (r=0.93). A positive correlation between biomass and richness (r=0.73) and size (r=0.88) was noted. Fish size was positively correlated with richness (r=0.94) and Shannon (r=0.77).
Regression analysis showed a strong relationship between diversity and structural variables (Figure 12). Regression analysis showed a linear allometric relationship between wealth, abundance, biomass and size of fishery resources characterized by positive or negative intercepts, positive slopes and coefficient of determination (R2=0.47) (Table 1). The relationship between biomass and wealth is characterized by a positive intercept (6.33), a positive slope (0.34) and a coefficient of determination (R2=0.38). The relationship between abundance and richness is characterized by the following equation: Abundance =-37.39 + 10.83*Richness, with the coefficient of determination (R2=0.41). A strong positive relationship between abundance and biomass was defined by the following line: Abundance=1.64+7.45*Biomass, with 66.23% of the biomass explained by abundance. The relationship between size and biomass gives the following equation: Size=132.14+8.21* Biomass with a coefficient of determination (R2=0.4).
Table 1. Relationship between diversity and structural variables, abundance and biomass.

Intercept

Slope

Richesse~Biomasse

6.33

0.34

0.3819

Abondance~Biomasse

1.64

7.45

0.6623

Abondance~Richesse

-37.39

10.83

0.4072

Taille~Biomasse

132.14

8.21

0.4447

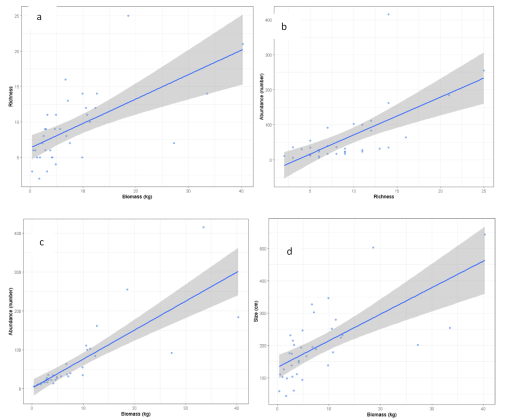
Figure 12. Relationship between richness, biomass and abundance (a and b), Biomass, abundance and size (c and d).
4. Discussion
4.1. Diversity of Fisheries Resources in Saloum Delta
A total of 58 species belonging to 46 genera and 31 families were identified in Gandoule Marine Protected. After three campaigns, , recorded respectively 51 species and 72 species belonging to 35 families in Bamboung bolon. The results of also revealed that in the protected lagoon reserves, the specific richness is lower than that obtained in Saloum, with 38 fish species belonging to 22 families.. However, our results present limitations, particularly regarding the seasons. We devoted our studies to two seasons (hot and cold) for lack of means. Four seasons (hot season, warm-cold transition, cold and cold-warm transition) needed to be studied.
The three-year monitoring (2020-2022) revealed a gradual decline in diversity and abundance of fishery resources. Over 10 years (1992 to 2002), the number of fish species in Sine Saloum estuary remained relatively stable (about 55 species). The exploitable species richness and functional diversity of fisheries resources in Saloum Delta are decreasing These declines of biodiversity could be explained by habitat losses with certain resource exploitation methods, drought, salinity, declining rainfall and overfishing (the use of small meshes). A positive correlation between richness, biomass and abundance was noticed. For abundance and biomass, a very strong correlation is noted. Strong and significant relationships were noted between abundance and biomass and richness and biomass
4.2. Weight and Structural Characteristics of Fisheries Resources
The results showed a variable distribution of the biomass. The most important is observed at Donakal, and the lowest at Pass Diamniadio. Bamboung was more important in biomass (103.1kg/season), and the lowest biomass was observed at Sangako (54.9kg/season) . The development of fisheries resources was explained by the richness of the waters in nutrients and phytoplankton, as well as physico-chemical parameters favorable to fish growth in Bamboung, such as temperature . Over the past few decades, total biomass and catch diversity have declined, with a few species becoming increasingly dominant . Between 2006 and 2007, the same trends were observed, whereas between 2005 and 2006, there was a slight increase in biomass . This decline can be caused by low rainfall, high temperatures, and nutrient poverty in the waters.
The size of individuals varied according to the sites. The high proportion of larger individuals was recorded in Baradia, and the smaller individuals in Pass Diamniadio. The results on the structure by year also revealed smaller individuals in 2020 and the larger ones in 2022. On the other hand, there is a decrease in the proportion of smaller individuals between 2020 and 2022. Between 2003 and 2012, the annual evolution curve of the maximum observed size of fish population in Marine Protected Area showed an increasing trend, regardless of the season . The average size of individuals in 2020 was larger. But between 2021 and 2022, there was an increase in the average size. The fish population observed in Marine Protected Area between 2008 and 2010 was composed of both small and medium-sized individuals .
5. Conclusions
The Gandoule Marine Protected Area, although still a reservoir of biodiversity, showed signs of ecological degradation, probably related to anthropogenic pressure and environmental changes. The results showed significant disparities between sites and years, with a regression of diversity and abundance, a reduction in biomass, and an increase in the proportion of small individuals, particularly between 2020 and 2022. This trend indicated a likely overfishing of large individuals and insufficient renewal of fish populations. The statistical analyses revealed positive correlations between wealth, biomass, size and abundance, highlighting the interdependence of these variables for assessing the state of resources. Now, it becomes urgent to strengthen conservation efforts, awareness and participatory management. The restoration of habitats, the regulation of fishing activities and the active involvement of local communities appear as essential levers to stop this degradation and promote a sustainable exploitation of the resources of the Saloum delta.
Abbreviations

MPA

Marine Protected Area

Author Contributions
Aissatou Diedhiou: Conceptualization, Formal Analysis, Investigation, Methodology, Software, Validation, Visualization, Writing – original draft, Writing – review & editing.
Serigne Modou Sarr: Conceptualization, Methodology, Software, Supervision, Validation, Visualization, Writing – review & editing.
Antoine Sambou: Conceptualization, Methodology, Software, Supervision, Validation, Visualization, Writing – review & editing.
Funding
This work is not supported by any external funding.
Data Availability Statement
The data is available from the corresponding author upon reasonable request.
Conflicts of Interest
The authors declare no conflicts of interest.
Appendix
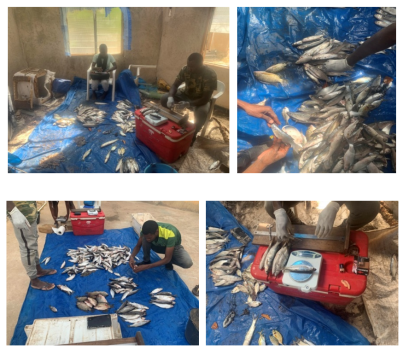
Figure 13. Images of sorting, counting, and measuring fish species.
Table 2. Fish species caught.

Families

Genera

Species

Mugilidae

Mugil

Mugil bananensis

Mugil cephalus

Mugil curema

Neochelon

Neochelon falcipinnis

Parachelon

Parachelon grandisquamis

Chelon

Chelon dumerili

Carangidae

Caranx

Caranx hippos

Caranx senegallus

Chloroscombrus

Chloroscombrus chrysurus

Cichlidae

Coptodon

Coptodon guineensis

Hemichromis

Hemichromis fasciatus

Sarotherodon

Sarotherodon melanotheron

Haemulidae

Plectorhinchus

Plectorhinchus macrolepis

Pomadasys

Pomadasys incisus

Pomadasys jubelini

Muricinae

Murex

Murex cornutus

Murex duplex

Murex sp

Portunidae

Penaeus

Penaeus notialis

Callinectes

Callinectes sp

Batrachoidae

Batrachoides

Batrachoides liberiensis

Batrachoides sp

Halobatrachus

Halobatrachus didactylus

Clupeidae

Ethmalosa

Ethmalosa fimbriata

Sardinella

Sardinella maderensis

Gerreidae

Gerres

Gerres nigri

Eucinostomus

Eucinostomus melanopterus

Elopidae

Elops

Elops lacerta

Elops senegalensis

Dasyatidae

Fontitrygon

Fontitrygon margarita

Dasyatis

Dasyatis margarita

Cynoglossus

Cynoglossus senegalensis

Monodactylidae

Monodactylus

Monodactylus sebae

Psettias

Psettias sebae

Sphyraenidae

Sphyraena

Sphyraena afra

Sphyraena sphyraena

Scorpaenidae

Scorpaena

Scorpaena scorfa

Melongenidae

Pugilina

Pugilina morio

Melongena

Melongena sp

Volutidae

Cymbium

Cymbium pepo

Cymbium sp

Tetraodontidae

Ephippion

Ephippion guittifer

Serranidae

Epinephelus

Epinephelus aeneus

Pristigasteridae

Ilisha

Ilisha africana

Polynemidae

Polydactilus

Polydactilus quadrifilis

Psettodidae

Psettedos

Psettedos belcheri

Sepiidae

Sepia

Sepia officinalis

Moronidae

Dicentrarchus

Dicentrarchus punctatus

Acanthuridae

Acantherus

Acantherus monroviae

Lalistidae

Balistes

Balistes punctatus

Sciaenidae

Pseudotolithus

Pseudotolithus brachygnathus

Rhinobatidae

Rhinobathos

Rhinobathos cemiculus

Syngnatidae

Hippocampus

Hippocampus sp

Hippocampus puntilatus

Hippocampus hippocampus

Paralichthyidae

Citharichtys

Citharichtys stamfilii

Drepaneidae

Drepane

Drepane africana

Ariidae

Carlarius

Carlarius parkii

References
[1] Wei, S., Zhang, H., & Ling, J. A review of mangrove degradation assessment using remote sensing: advances, challenges, and opportunities. GIScience & Remote Sensing. 2025, 62(1). p. 23.
[2] Albaret, J.-J., Diouf, P. S. Diversity of fish in West Africa Lagoons and estuaries. Annals of the Royal Museum for Central Africa. Zoological Sciences. 1994, (275) 165–177.
[3] Bassi, A. M., Casier, L., Pallaske, G., Perera, O., Bechauf, R. Sustainable Asset Valuation (SAVi) of the Saloum Delta in Senegal: an economic assessment of the Saloum Delta's contribution to sustainable development, focusing on wetlands and mangroves (technical report). SAVi, Canada. 2020, p. 48.
[4] Utami, W., Sugiyanto, C., & Rahardjo, N. Mangrove area degradation and management strategies in Indonesia: A review. Journal of Degraded and Mining Lands Management. 2024, 11(3), 6037–6047.
[5] Diouf, P. S., 1996. Fish populations in estuarine environments of West Africa: the example of the hyperhaline Sine-Saloum estuary (PhD Thesis). ORSTOM, Paris. 1996, p. 177.
[6] Dièye, E. H. B., Diaw, A. T., Sané, T., Ndour, N.. Dynamics of the Mangrove in the Saloum Estuary (Senegal) between 1972 and 2010. Cybergeo: European Journal of Geography. 2013, p. 86.
[7] Ministry of Environment and Nature Protection (MEPN). Fourth national report on the implementation of the Convention on Biological Diversity. Senegal. 2010, p. 105.
[8] Marius, C. The soils of the Saloum estuary. ORSTOM. 1973, p. 40
[9] Dia, I. M. M. Development and implementation of an integrated management plan-Saloum Delta Biosphere Reserve, Senegal. 2003, p. 145.
[10] Ausseil-Badie, J., Barusseau, J. P., Descamps, C. Holocene deltaic sequence in the Saloum estuary, Senegal. Quatermuy Research 1978–1994. 1991, (36) 178-194.
[11] Guissé, A., Faye, M. N., Diallo, N. Influence of pH, water salinity, and soil texture on the vegetation of the Saloum estuary mangrove in Senegal. Journal of Science and Technology.. 2007, (5) 8–17.
[12] Ndiaye, F. S.Assessment of the EBS of the Gandoul Marine Protected Area (AMPG) and the Palmarin Community Nature Reserve (RNCP). Final Report. Directorate of Community Marine Protected Areas. 2017, p.81.
[13] MPA_Gandoule. Management and Development Plan for the Gandoule Marine Protected Area (2023-2027). Directorate of Community Marine Protected Areas, Senegal. 2023, p. 86
[14] MPA_Sangomar. Management and Development Plan of the Sangomar Marine Protected Area (2014-2017) (Final Version). Directorate of Community Marine Protected Areas, Senegal. 2014, p. 62.
[15] Fall, M. Actor dynamics, conflicts, and modes of resolution for sustainable management of natural resources in the Saloum Delta Biosphere Reserve (Senegal).2007. p. 284.
[16] Dia, I. M. The Saloum Delta Biosphere Reserve.. 2005, 9–10.
[17] Ndour, N., Dieng, S. D., Fall, M. Roles of mangroves, management methods and perspectives in the Saloum Delta (Senegal). VertigO - the electronic journal of environmental sciences.. 2012, p. 15.
[18] Diouf, A. C., Diallo, M. S., Ba, M. D., Ba, A. I. W. Biogeography of wetlands facing multiple constraints: the case of the Saloum Delta Biosphere Reserve in Senegal. 2021. 325–341.
[19] Ramade, F. Elements of Ecology: Fundamental Ecology. 3rd edition, Dunod, Paris. 2003, p. 690.
[20] Albaret, J.-J. Characterization of the baseline status of fish populations in a protected area in the mangrove zone: the Bolon of Bamboung (Sine Saloum, Senegal). Dakar, Senegal; IRD; OCEANIUM. 2003, p. 51.
[21] De Morais, L. T., Simier, M., Raffray, J., Sadio, O. Biological monitoring of fish populations in a protected area in a mangrove zone: the Bolon of Bamboung (Sine Saloum, Senegal) (Final Report No.). Institute of Research for Development. Dakar. 2007, p. 23.
[22] AHOULOU, E. J., SORO, Y., DIAHA, N. C., DOFFOU, C. Y. EDOUKOU, A. Diversity of ichthyological fauna in some protected reserves in the Aby Lagoon, Ivory Coast. Journal of Applied Biosciences. 2024, 197: 20838 – 20853.
[23] Ecoutin, J. M., Sadio, O., Simier, M., Raffray, J., Tito de Morais, L. Changes over a decade in fish assemblages exposed to both environmental and fishing constraints in the Sine Saloum estuary (Senegal). Estuarine, Coastal and Shelf Science, mechanisms of sediment retention in estuaries 87. 2010. 284–292.
[24] Sadio, O. Evaluation of the effectiveness of Marine Protected Areas as a tool for the restoration of marine resources and the management of fish stocks: the West African experience (PhD thesis). University of Western Brittany – Brest. 2015. p. 257.
[25] Ecoutin, J. M., Sadio, O., Simier, M., Raffray, J., Tito de Morais, L. Comparison of fish populations in a protected mangrove area (the Bolon de Bamboung, Sine Saloum, Senegal) with the populations of two nearby unprotected sites subject to fishing activities Years 2008-2010 (Research Report No. CSRP/AFD/C11/2011). LEMAR-IRD. 2012, p. 67.
[26] Bénech, V., Ouattara, S. Role of variations in water conductivity and other external factors in ovarian growth of a tropical fish, Brycinus leuciscus (Characidae). Aquatic Living Resources 3. 1990, 153–162.
[27] Attingli, A. H., Zinsou, L. H., Vissin, E. W., Laleye, P. A. Spatial distribution of physicochemical parameters in the fisheries of the Lower Ouémé Valley (southern Benin). Journal of Applied Biosciences 105. 2016, 10190–10202.
[28] Faye, D. Study of the food web in the tropical and estuarine marine protected area of Bamboung, Sine-Saloum: ecological implications of fish morphology, richness, abundance, and biomass. 2011, p. 230.
Cite This Article
  • APA Style

    Diedhiou, A., Sarr, S. M., Sambou, A. (2026). Diversity of Fishery Resources in Mangrove Ecosystems: Case of Saloum Delta in Senegal. Agriculture, Forestry and Fisheries, 15(1), 22-36. https://doi.org/10.11648/j.aff.20261501.13

    Copy | Download

    ACS Style

    Diedhiou, A.; Sarr, S. M.; Sambou, A. Diversity of Fishery Resources in Mangrove Ecosystems: Case of Saloum Delta in Senegal. Agric. For. Fish. 2026, 15(1), 22-36. doi: 10.11648/j.aff.20261501.13

    Copy | Download

    AMA Style

    Diedhiou A, Sarr SM, Sambou A. Diversity of Fishery Resources in Mangrove Ecosystems: Case of Saloum Delta in Senegal. Agric For Fish. 2026;15(1):22-36. doi: 10.11648/j.aff.20261501.13

    Copy | Download

  • @article{10.11648/j.aff.20261501.13,
      author = {Aissatou Diedhiou and Serigne Modou Sarr and Antoine Sambou},
      title = {Diversity of Fishery Resources in Mangrove Ecosystems: Case of Saloum Delta in Senegal},
      journal = {Agriculture, Forestry and Fisheries},
      volume = {15},
      number = {1},
      pages = {22-36},
      doi = {10.11648/j.aff.20261501.13},
      url = {https://doi.org/10.11648/j.aff.20261501.13},
      eprint = {https://article.sciencepublishinggroup.com/pdf/10.11648.j.aff.20261501.13},
      abstract = {The objective of this study is to enhance the understanding of the diversity and structure of fishery resources. To achieve this, we conducted beach seine catches in two seasons from 2020 to 2022 at six sites within the Gandoule Marine Protected Area. All individuals captured were identified and counted, and their weight and size were measured. In total, 58 species from 46 genera and 31 families were recorded. Diversity, weight, and growth parameters of fishery resources showed variation across time and locations. Species richness and abundance varied significantly (p0.05) in overall diversity among sites and years. Analysis of structural characteristics revealed significant spatio-temporal variation in biomass (P<0.05). Donakal (20.14±6.43kg) showed higher biomass than Pass Fambine (5.11±1.55kg). Biomass declined from 11.81±11.54kg in 2020 to 3.97±2.36kg in 2022, while the proportion of small fish rose from 69.47% to 72.73%. Fish length decreased significantly (p<0.05) over the study period, from 257.12±40.69cm to 157.48±16.71cm. Despite some contradictory data on the proportion of small fish (which rose then fell), the trends indicate a decline in fishery resources in the Saloum Delta, attributed to overexploitation, habitat degradation, and climate change.},
     year = {2026}
    }
    

    Copy | Download

  • TY  - JOUR
    T1  - Diversity of Fishery Resources in Mangrove Ecosystems: Case of Saloum Delta in Senegal
    AU  - Aissatou Diedhiou
    AU  - Serigne Modou Sarr
    AU  - Antoine Sambou
    Y1  - 2026/01/26
    PY  - 2026
    N1  - https://doi.org/10.11648/j.aff.20261501.13
    DO  - 10.11648/j.aff.20261501.13
    T2  - Agriculture, Forestry and Fisheries
    JF  - Agriculture, Forestry and Fisheries
    JO  - Agriculture, Forestry and Fisheries
    SP  - 22
    EP  - 36
    PB  - Science Publishing Group
    SN  - 2328-5648
    UR  - https://doi.org/10.11648/j.aff.20261501.13
    AB  - The objective of this study is to enhance the understanding of the diversity and structure of fishery resources. To achieve this, we conducted beach seine catches in two seasons from 2020 to 2022 at six sites within the Gandoule Marine Protected Area. All individuals captured were identified and counted, and their weight and size were measured. In total, 58 species from 46 genera and 31 families were recorded. Diversity, weight, and growth parameters of fishery resources showed variation across time and locations. Species richness and abundance varied significantly (p0.05) in overall diversity among sites and years. Analysis of structural characteristics revealed significant spatio-temporal variation in biomass (P<0.05). Donakal (20.14±6.43kg) showed higher biomass than Pass Fambine (5.11±1.55kg). Biomass declined from 11.81±11.54kg in 2020 to 3.97±2.36kg in 2022, while the proportion of small fish rose from 69.47% to 72.73%. Fish length decreased significantly (p<0.05) over the study period, from 257.12±40.69cm to 157.48±16.71cm. Despite some contradictory data on the proportion of small fish (which rose then fell), the trends indicate a decline in fishery resources in the Saloum Delta, attributed to overexploitation, habitat degradation, and climate change.
    VL  - 15
    IS  - 1
    ER  - 

    Copy | Download

Author Information
  • Abstract
  • Keywords
  • Document Sections

    1. 1. Introduction
    2. 2. Materials and Methods
    3. 3. Results
    4. 4. Discussion
    5. 5. Conclusions
    Show Full Outline
  • Abbreviations
  • Author Contributions
  • Funding
  • Data Availability Statement
  • Conflicts of Interest
  • Appendix
  • References
  • Cite This Article
  • Author Information